AWS EC2 Topology Graph 📊
What is the EC2 Topology API?
AWS Instance Topology gives you details on the interconnect between ec2 instances. It’s helpful to determine if all the nodes are co-located on the same spine and can even be used when trying to make scaling decision for large ML training runs or HPC jobs.
To call the API, you’ll need at least aws cli version 2.13.36. You can check the version with:
$ aws --version
aws-cli/2.15.8 Python/3.11.6 Darwin/22.6.0 exe/x86_64 prompt/off
Then you can run:
aws ec2 describe-instance-topology
This will return a JSON output similar to the following:
{
    "Instances": [
        {
            "InstanceId": "i-1111111111example",
            "InstanceType": "p4d.24xlarge",
            "GroupName": "my-ml-cpg",
            "NetworkNodes": [
                "nn-1111111111example",
                "nn-2222222222example",
                "nn-3333333333example"
            ],
            "ZoneId": "usw2-az2",
            "AvailabilityZone": "us-west-2a"
        },
        {
            "InstanceId": "i-2222222222example",
            "InstanceType": "p4d.24xlarge",
            "NetworkNodes": [
                "nn-1111111111example",
                "nn-2222222222example",
                "nn-3333333333example"
            ],
            "ZoneId": "usw2-az2",
            "AvailabilityZone": "us-west-2a"
        },
...
This is great but hard to visualize, hence why we’re adding D3 Graph to this output.
How do we interpret this data?
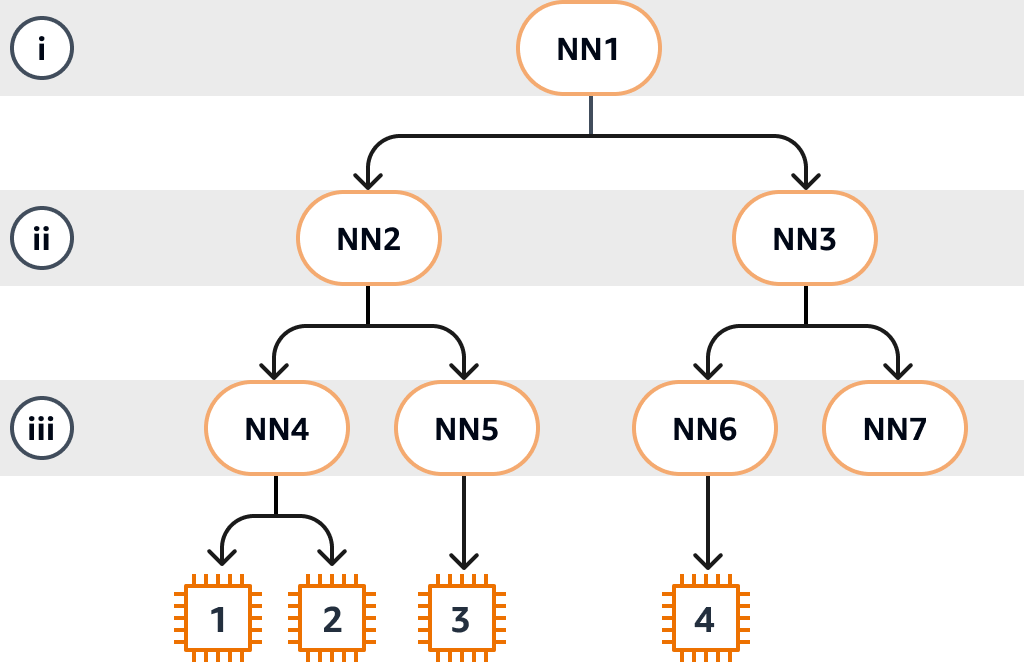
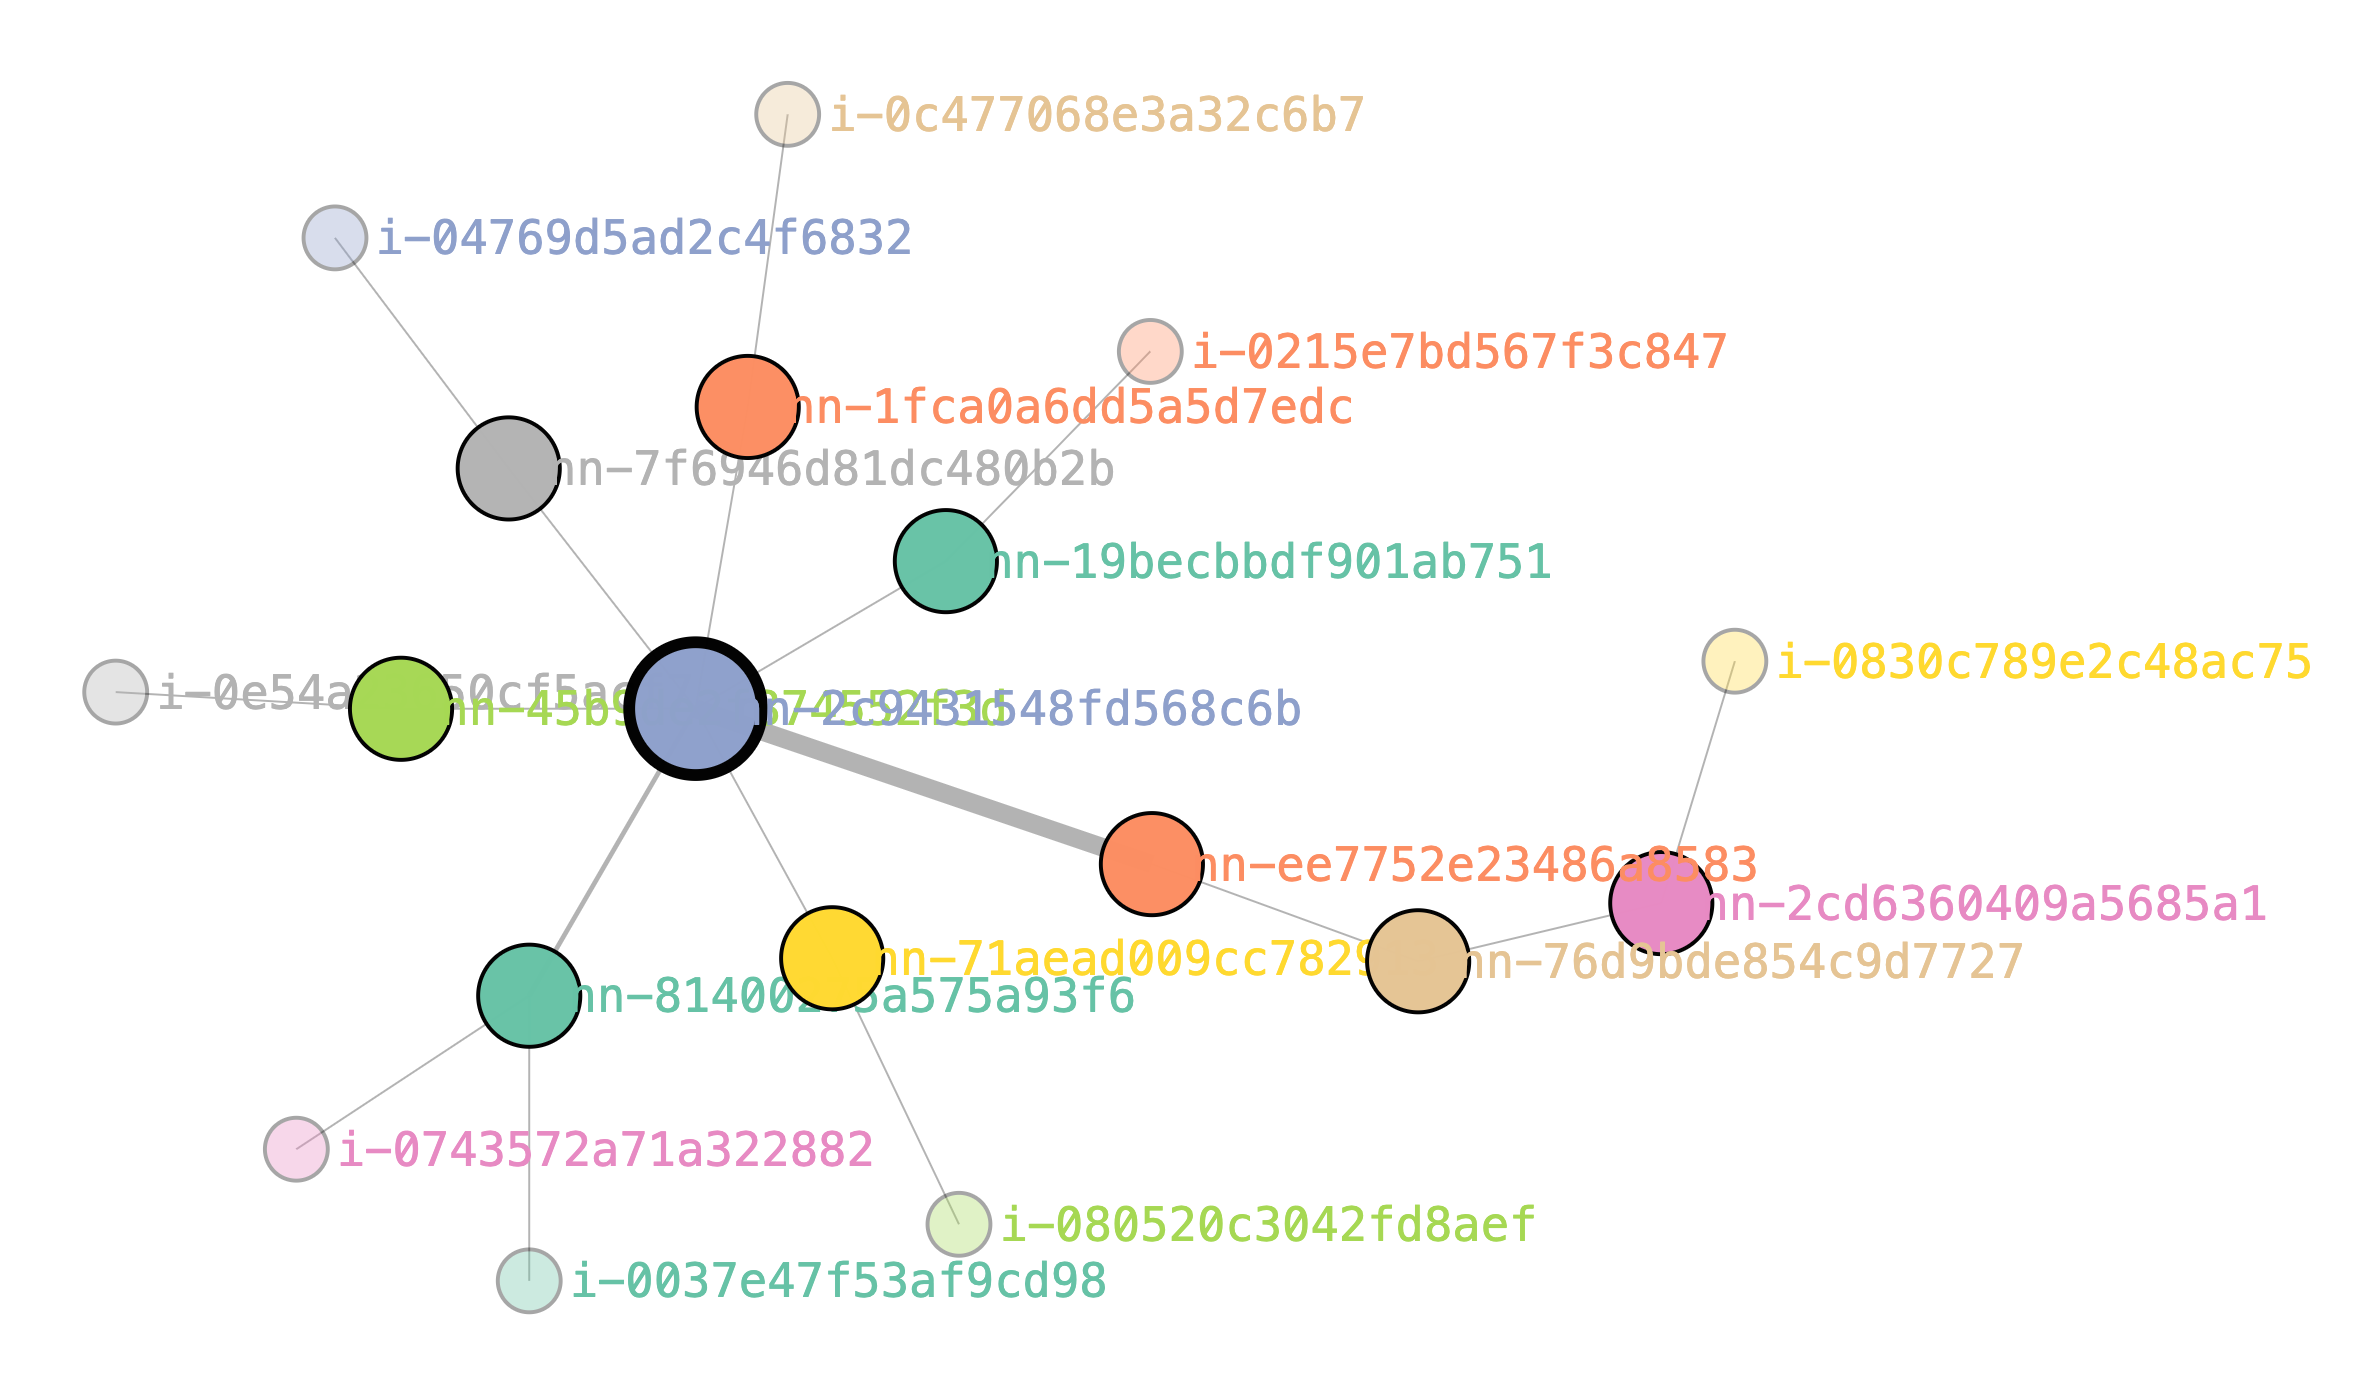
Each instance has a set of three network nodes, these are ordered from furthest to closest to the instance, so Layer 3 is closest to the instance. The best possible latency comes from two instances with the same Layer 3 switch.
| Layer | Network Node |
|---|---|
| Layer 3 (closest to instance) | nn-3333333333example |
| Layer 2 | nn-2222222222example |
| Layer 1 | nn-1111111111example |
A cluster entirely connected looks like:
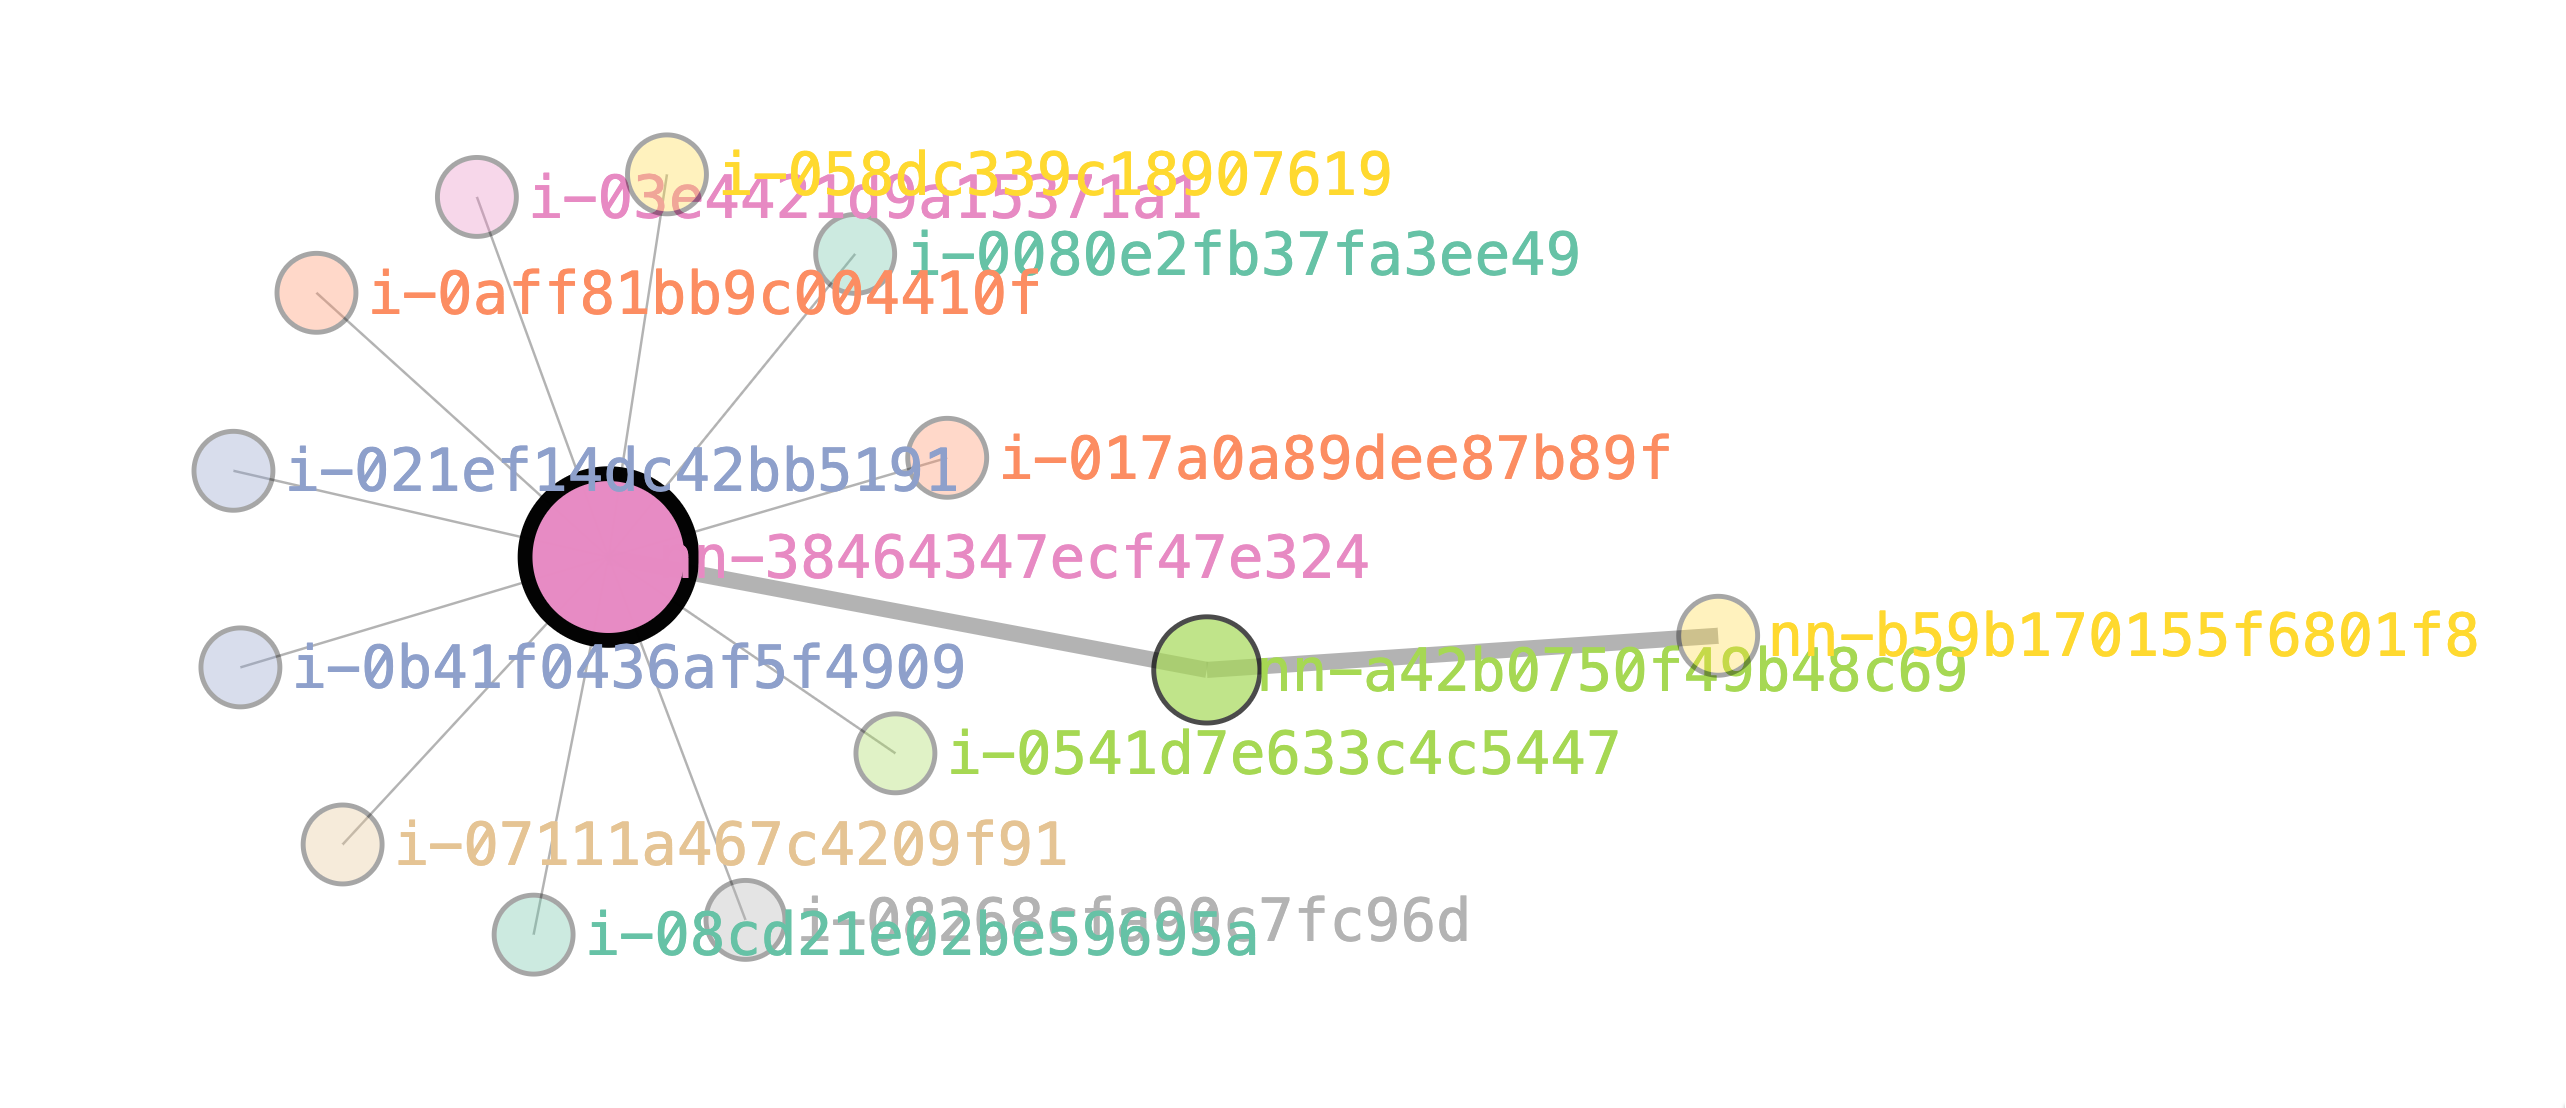
A mostly disconnected cluster looks like:
A highly interconnected cluster can be accomplished by placing the instances into a placement group, See EFA Best Practices for more.
What is D3 Graph?
D3 Graph is a python library that lets us create our graph in python and then converts the results into HTML + CSS.
- Install dependencies (suggest doing in a virtualenv):
pip3 install d3graph
pip3 install scikit-learn
pip3 install seaborn
pip3 install boto3
- Create a python script
instance-topology-graph.py
# Import library
from d3graph import d3graph, vec2adjmat
import boto3
from pprint import pprint

ec2 = boto3.client('ec2', region_name='us-west-2')

response = ec2.describe_instance_topology(Filters = [{'Name':'instance-type', 'Values':['p4de.24xlarge']}])

pprint(response.get('Instances'))

# Create example network
source = []
target = []
for instance in response.get('Instances'):
    # Layer 3 (closest to instance)
    source += [instance.get('InstanceId')]
    target += [instance.get('NetworkNodes')[2]]
    # Layer 2
    source += [instance.get('NetworkNodes')[2]]
    target += [instance.get('NetworkNodes')[1]]
    # Layer 1
    source += [instance.get('NetworkNodes')[1]]
    target += [instance.get('NetworkNodes')[0]]

pprint(source)
pprint(target)

# Convert to adjacency matrix
adjmat = vec2adjmat(source, target)

# # Initialize
d3 = d3graph()
# Proces adjmat
d3.graph(adjmat)
# Plot
d3.show()

# Make changes in node properties
d3.set_node_properties(color=adjmat.columns.values)
# Plot
d3.show(filepath='temp/')
- Next run it, changing region and instance type for your use case:
python3 d3.py
Voila! a file d3graph.html will get created in a temp/ directory. You can now open that file to see your instance topology.