GPU Monitoring with Grafana 📊
Grafana is an open source tool that allows us to create dashboards and monitor our cluster. In the following guide we’ll show you how to setup Grafana, Prometheus, Slurm exporter and DCGM Exporter to monitor a cluster. This will help you answer questions like:
- how many jobs/instances are running
- CPU utilization
- GPU Utilization
- Memory usage
- EFA (Network) Traffic
- Disk iops
We’ll setup the following exporters but don’t limit yourself to just these. There’s thousands of useful Prometheus exporters that can be plugged into this same architecture.
| Prometheus Exporter | Description |
|---|---|
| Slurm Prometheus Exporter | Slurm scheduler metrics such as number of jobs, instances in DOWN state, number of users ect. |
| DCGM Metrics | GPU Metrics |
| EFA Exporter | EFA traffic metrics such as packets sent and received. |
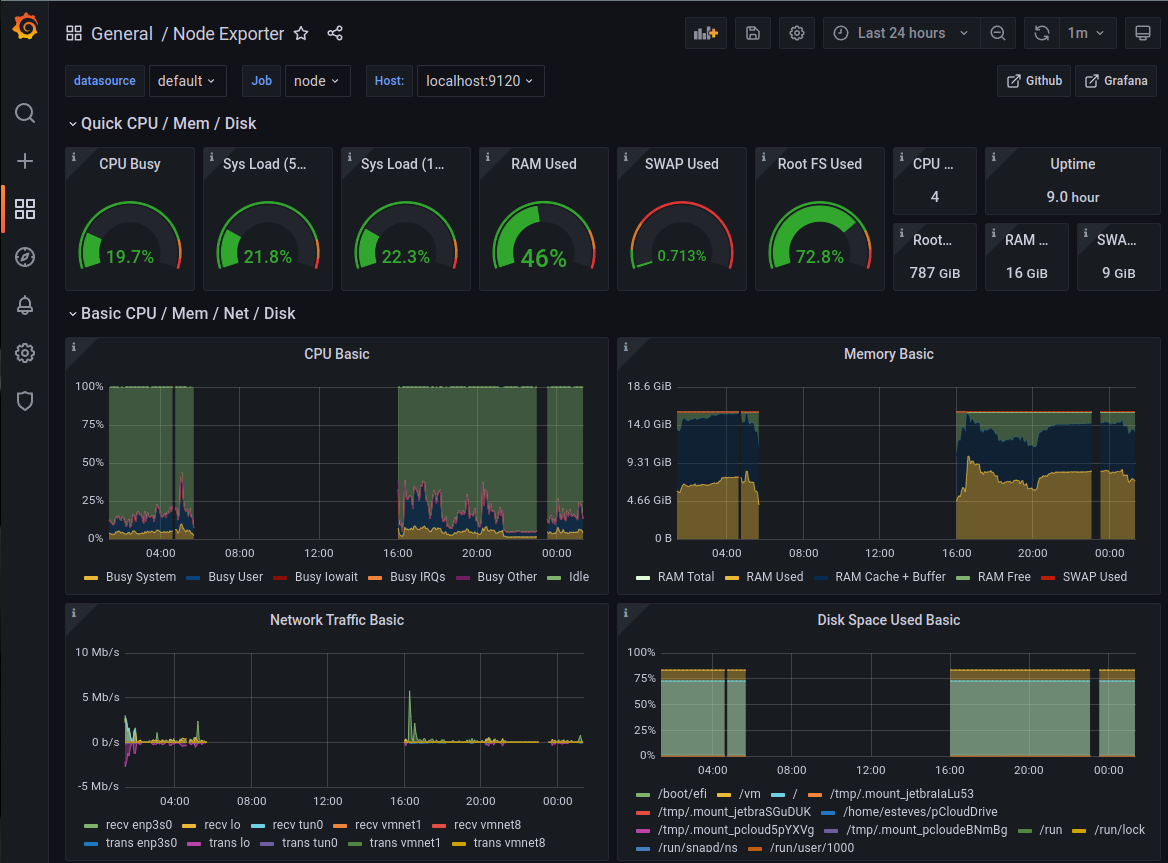
| Node Exporter | General instance information such as CPU Utilization, memory utilization, ect. |
In the following sections we set this up for AWS ParallelCluster, however the same steps apply to any Slurm based cluster.
Setup Cluster
The first step is to setup a cluster with AWS ParallelCluster, to aide in this process you can use the following template:
If you’re unfamiliar with AWS ParallelCluster and want more context, see my workshop.
If you don’t want to use the linked template make sure you include the policy arn:aws:iam::aws:policy/AmazonPrometheusFullAccess in the AdditionalIamPolicies section of the HeadNode and Compute Nodes like so:
Iam:
  AdditionalIamPolicies:
    - arn:aws:iam::aws:policy/AmazonPrometheusFullAccess
Setup Grafana
In this step we’ll setup Amazon Managed Grafana, this is a hosted version of Grafana that will plot metrics collected from Amazon Prometheus and Cloudwatch.
-
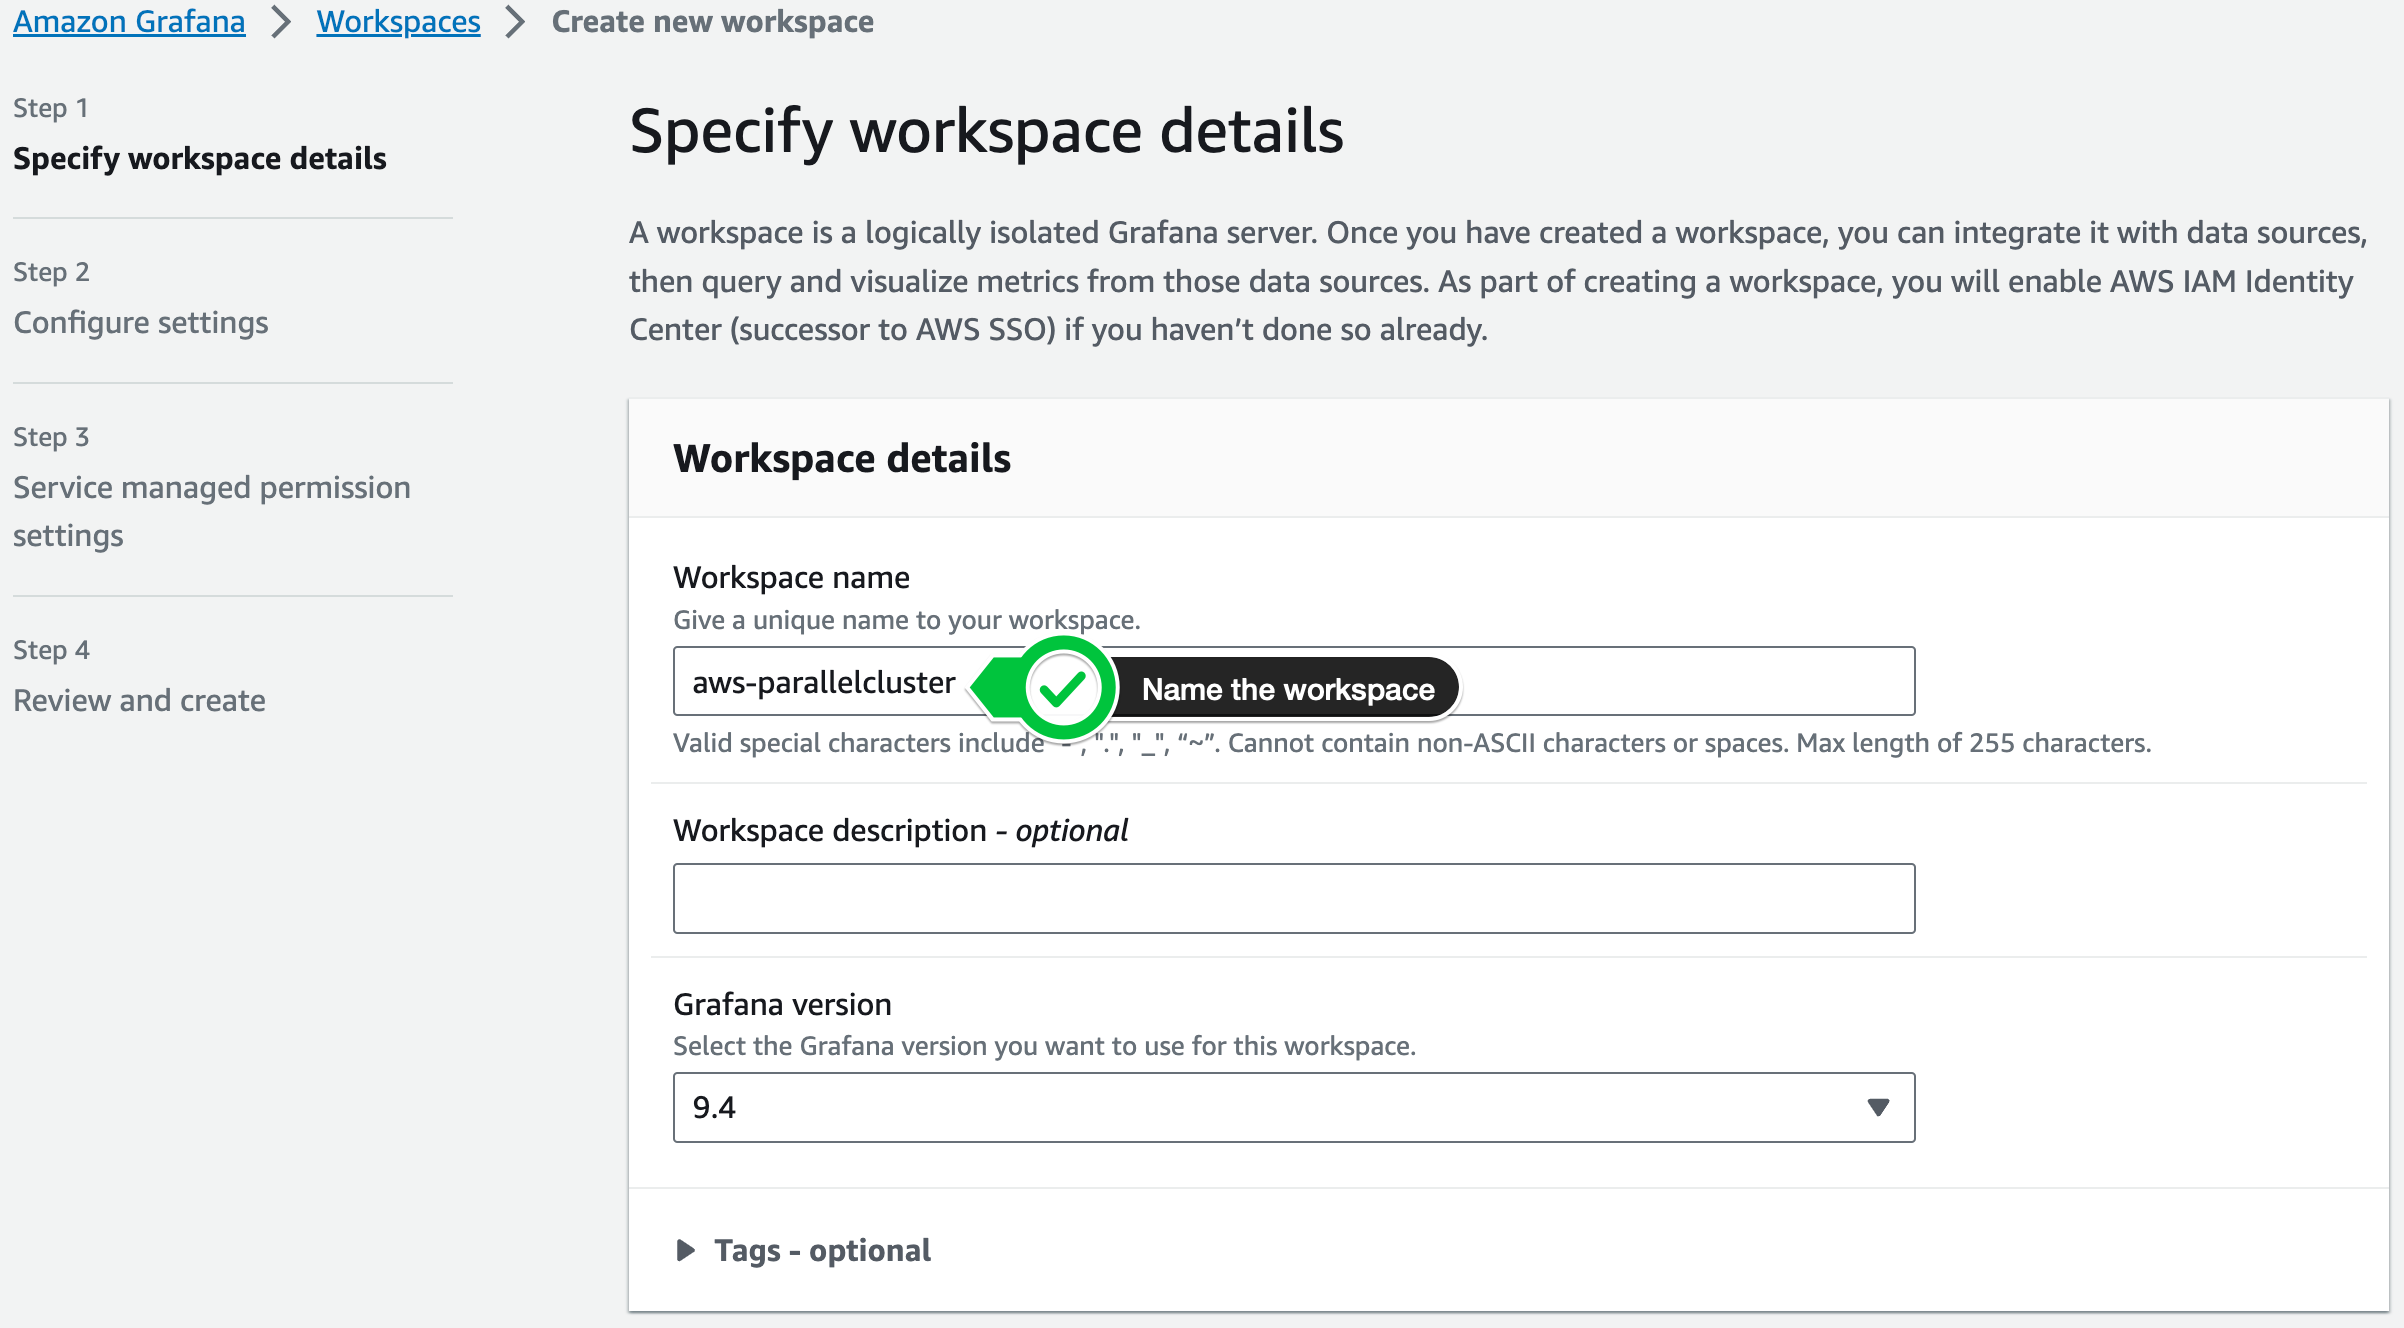
First navigate to the Grafana Console > click Create.
-
Next give it a name like aws-parallelcluster
-
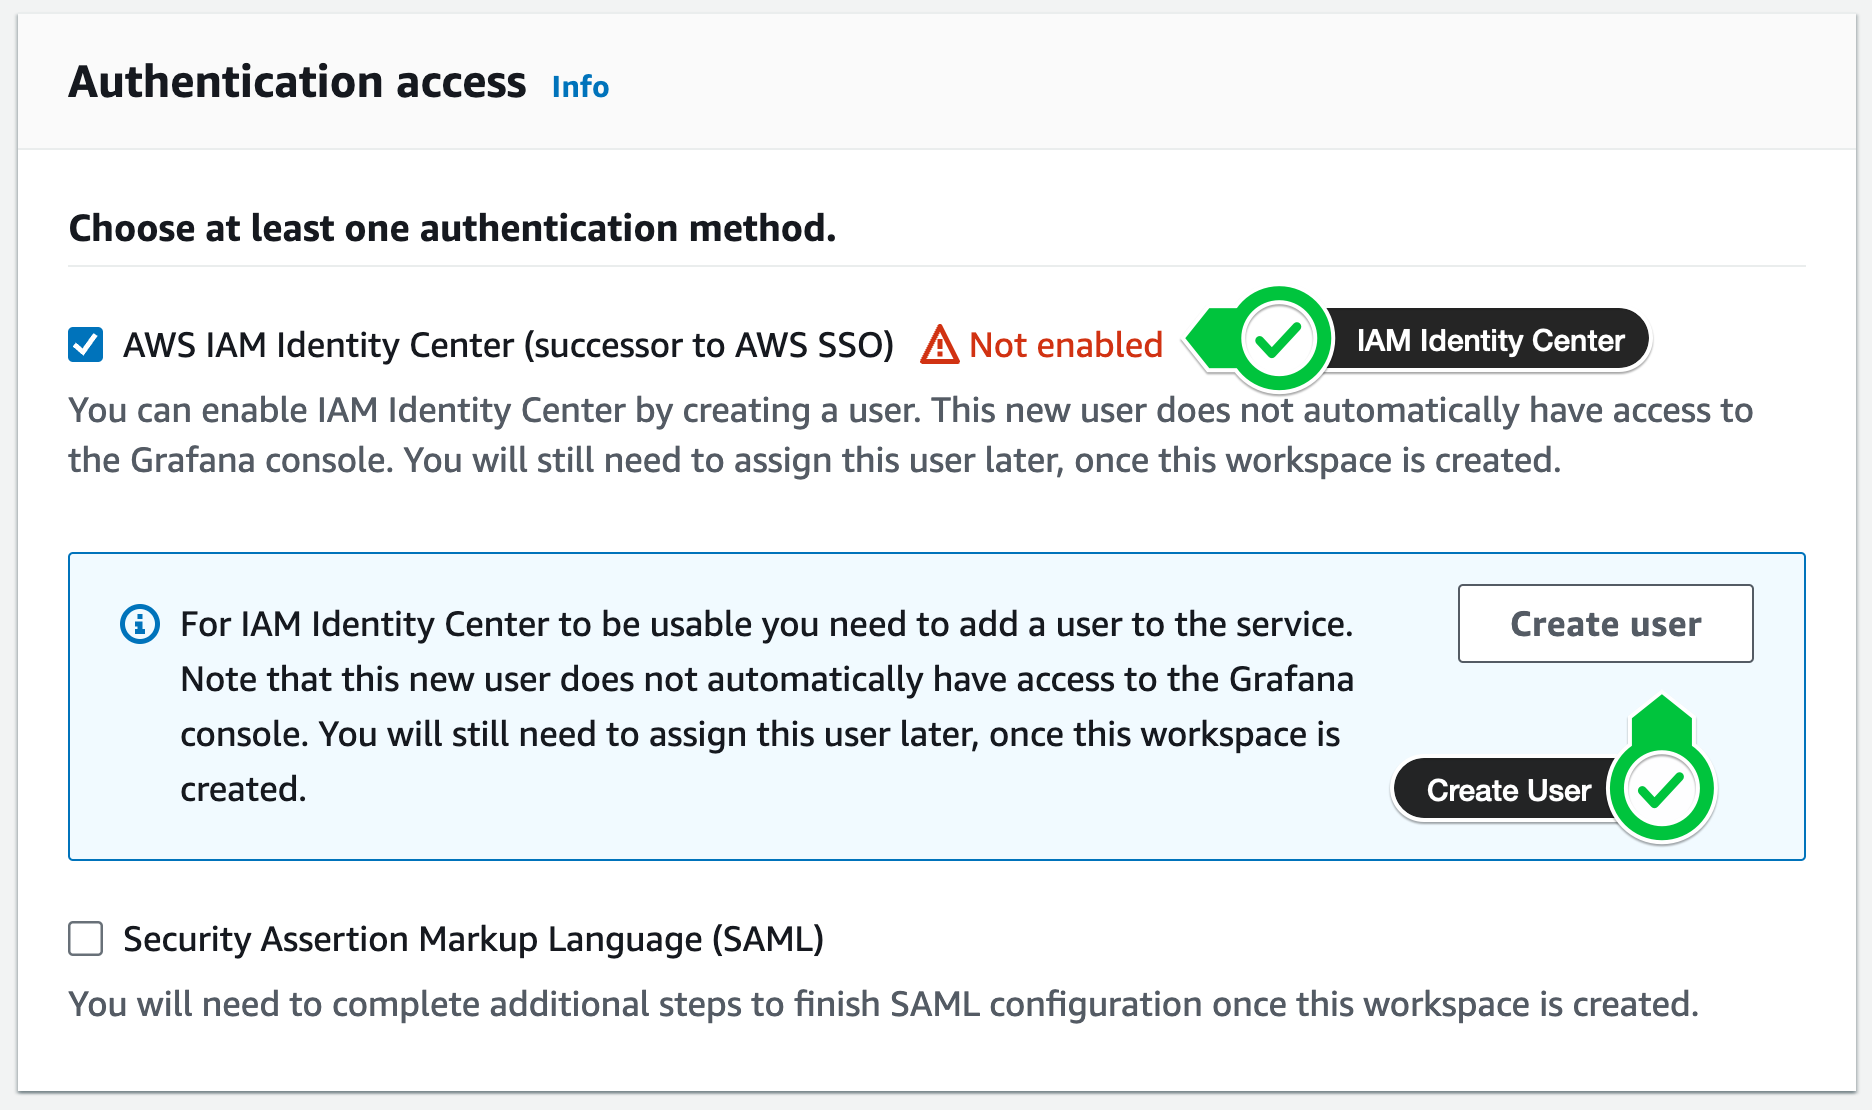
On the next screen select the following options:
- Select IAM Identity Center as the authentication access
- Click Create User
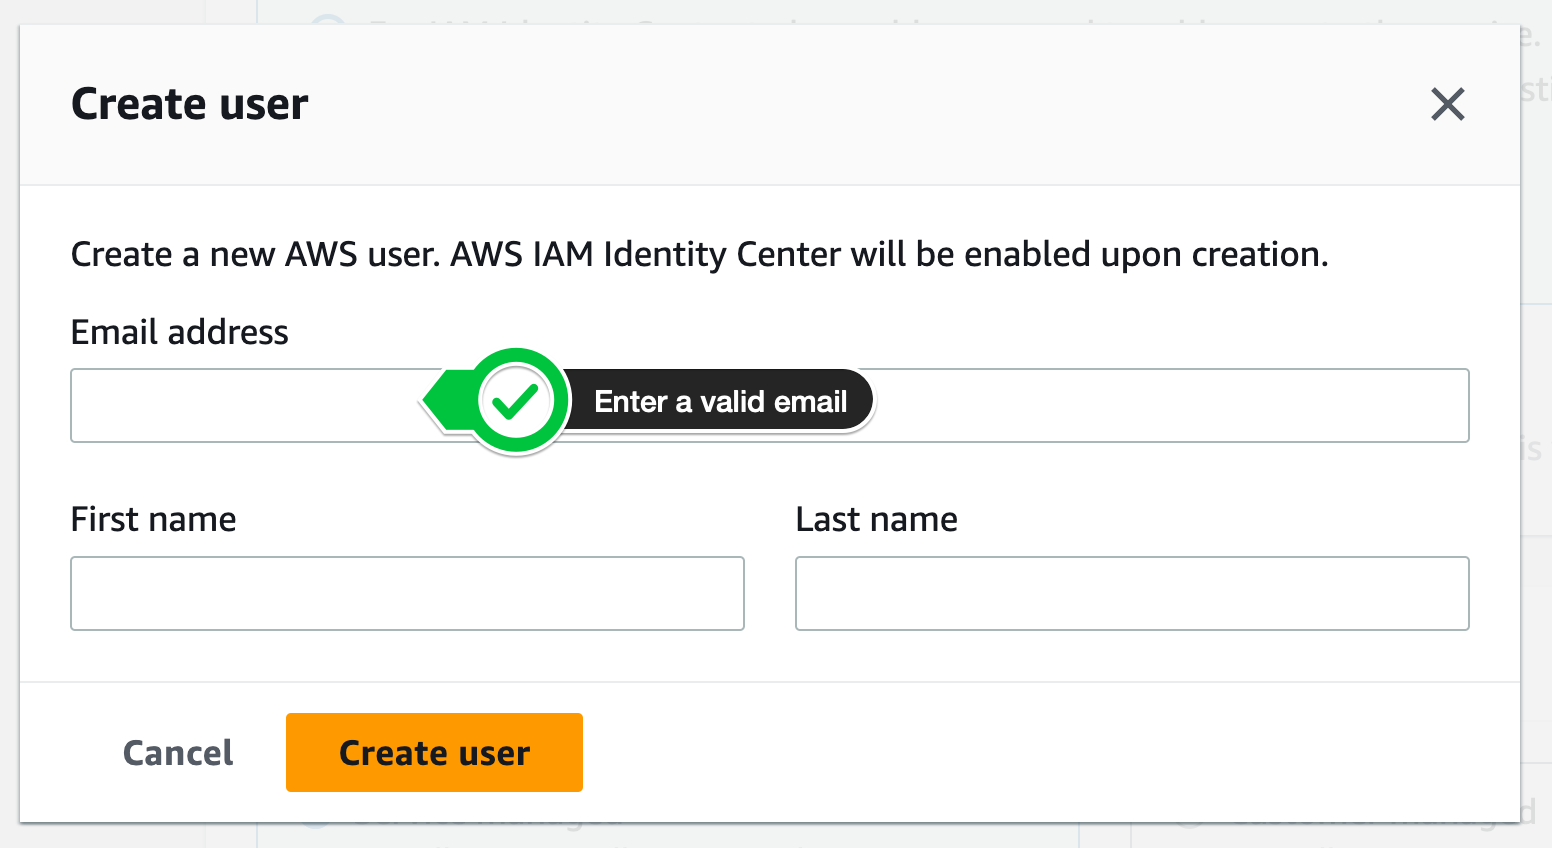
-
Next enter a valid email as well as First name and Last name
-
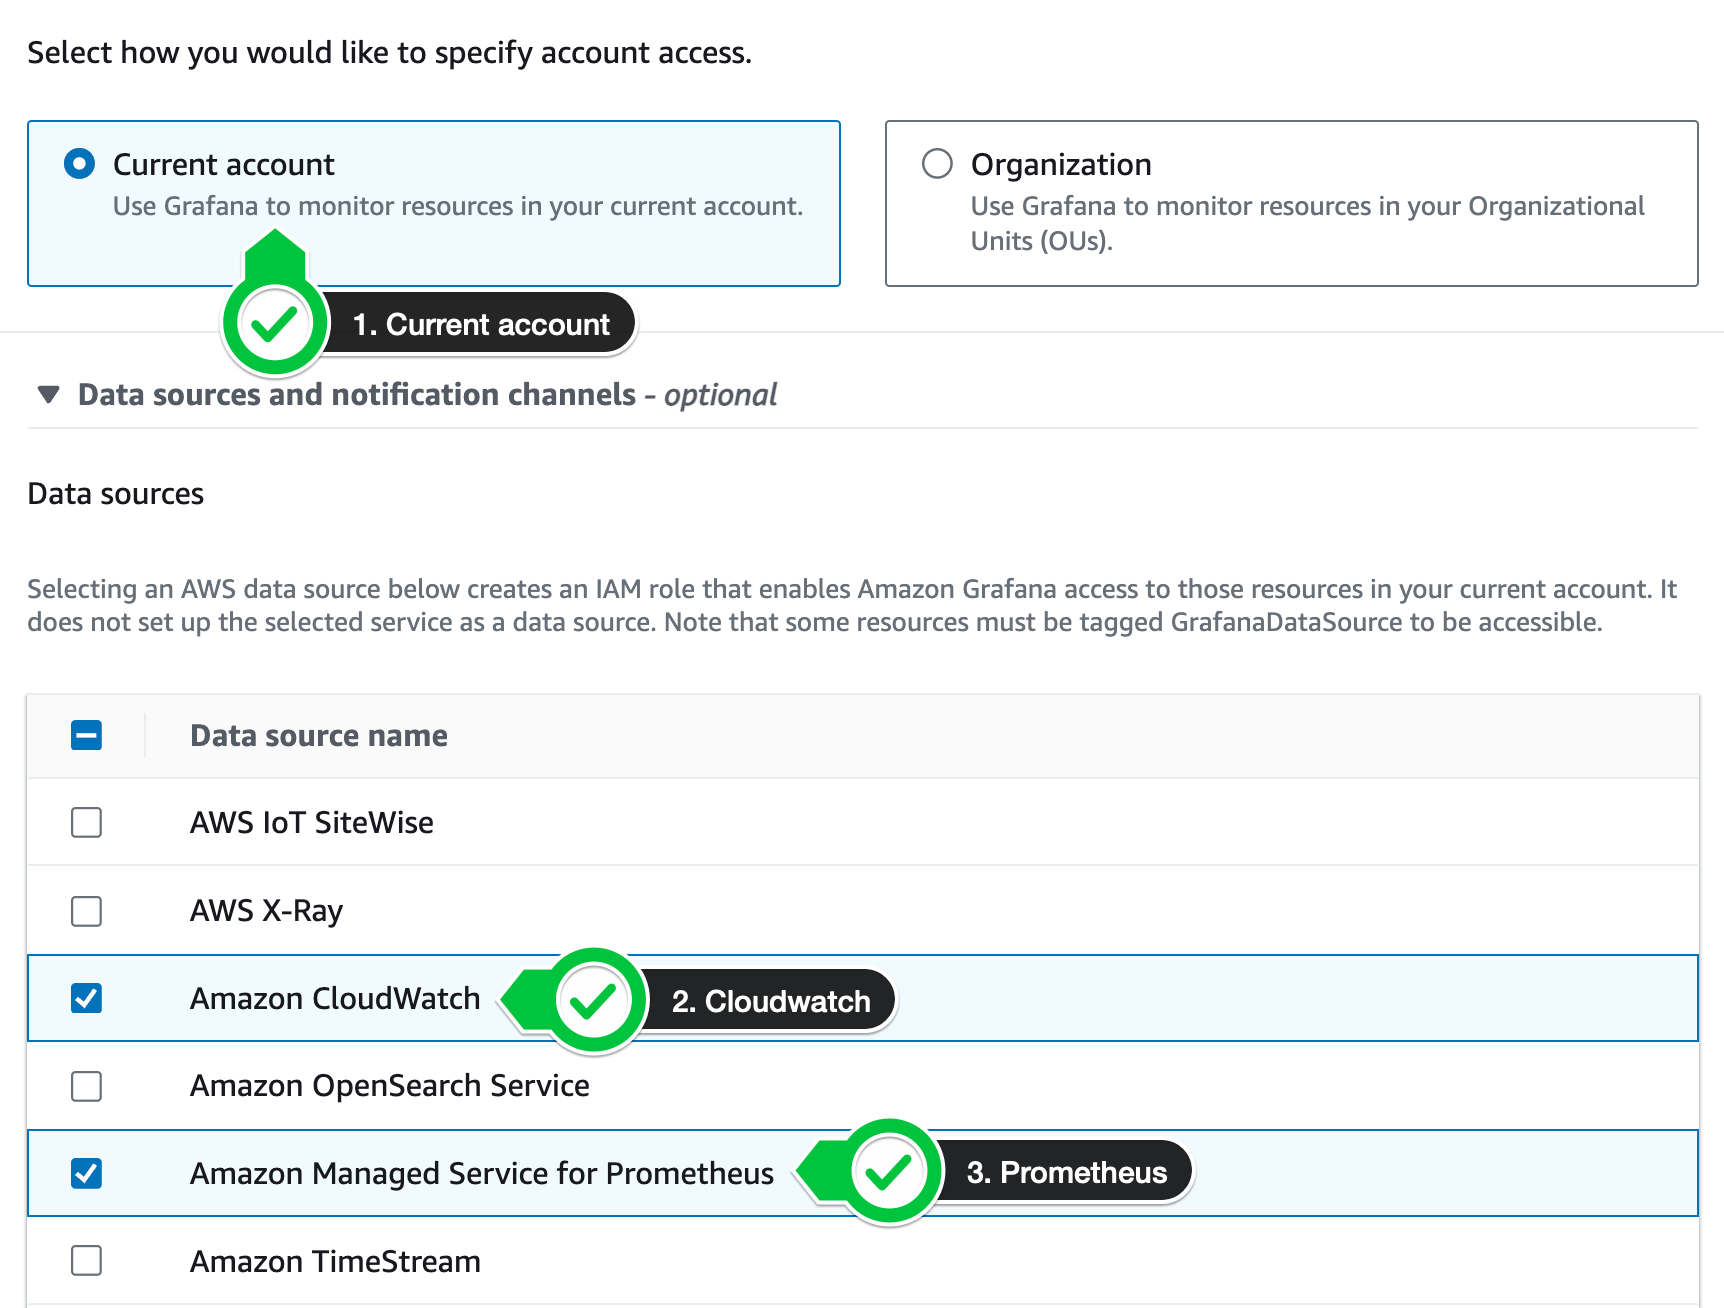
Enable the following two data sources
- Select Amazon Managed Service for Prometheus
- Select Amazon CloudWatch
-
On the next screen click Create Workspace
-
After the workshop creates click on the login link to sign in. It’ll look something like
https://g-4831a3dc3d.grafana-workspace.us-east-1.amazonaws.com/. You should have received an email with a password, enter that and your email to connect: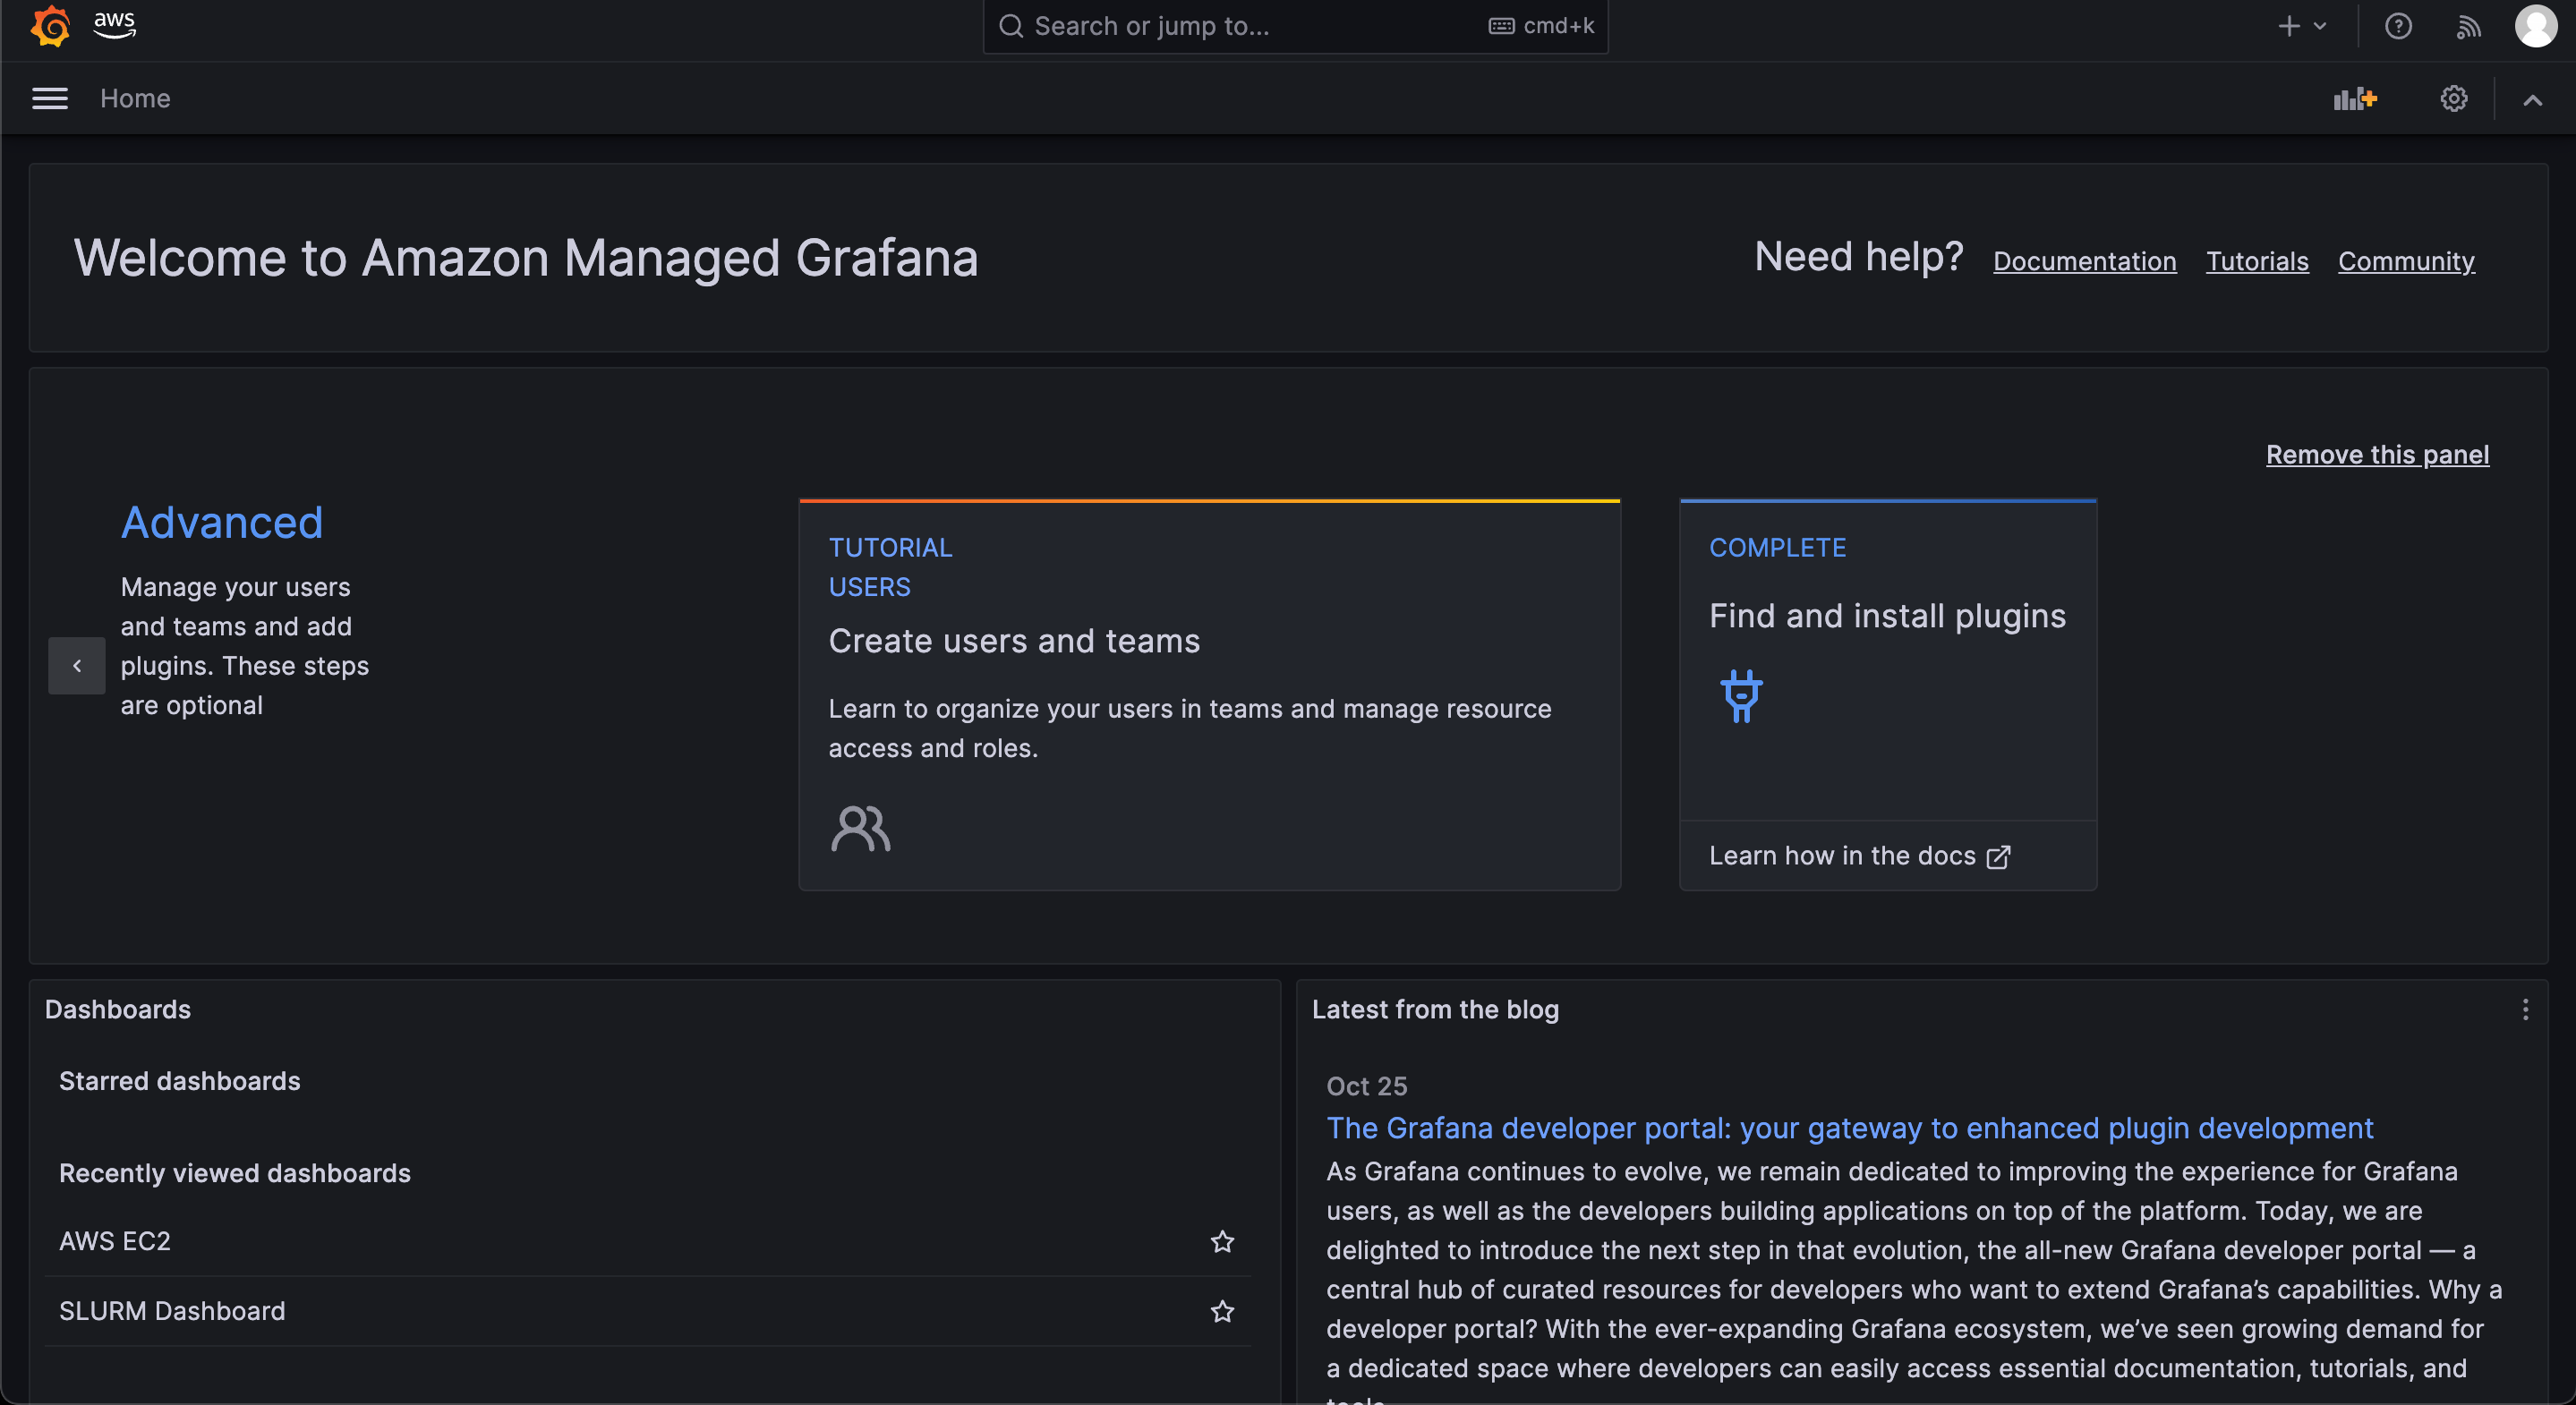
Congrats! you just created a managed Grafana Workspace. In the next section we’ll setup Prometheus, a time series database that’ll act as the data store for everything we want to graph on Grafana.
Setup Prometheus
In this step we’ll setup Prometheus using Amazon Managed Prometheus (AMP) a fully managed, serverless prometheus.
-
Create prometheus workspace using the AWS CLI
export AWS_DEFAULT_REGION=us-east-1
WORKSPACE_ID=$(sudo aws amp create-workspace --region $AWS_DEFAULT_REGION --alias aws-parallelcluster --query workspaceId)
echo $WORKSPACE_ID
echo "export WORKSPACE_ID=$WORKSPACE_ID" >> ~/.bashrc
echo "export AWS_DEFAULT_REGION=$AWS_DEFAULT_REGION" >> ~/.bashrc
``
-
Install prometheus server and setup a config file:
wget https://github.com/prometheus/prometheus/releases/download/v2.47.0/prometheus-2.47.0.linux-arm64.tar.gz
tar xvfz prometheus-*.tar.gz
cd prometheus-*
sudo mv prometheus /usr/bin/
sudo mv promtool /usr/bin/
``
-
Create a prometheus config file, make sure that
AWS_DEFAULT_REGIONandWORKSPACE_IDare set.
echo "WORKSPACE_ID: ${WORKSPACE_ID}"
echo "AWS_DEFAULT_REGION: ${AWS_DEFAULT_REGION}"

cat > prometheus.yml << EOF
global:
scrape_interval: 15s
evaluation_interval: 15s
scrape_timeout: 15s

scrape_configs:
- job_name: 'slurm_exporter'
	scrape_interval:  30s
	scrape_timeout:   30s
	static_configs:
	- targets: ['localhost:8080']

- job_name: 'ec2_instances'
	scrape_interval: 5s
	ec2_sd_configs:
	- port: 9100
		region: ${AWS_DEFAULT_REGION}
		refresh_interval: 10s
	- port: 9400
		region: ${AWS_DEFAULT_REGION}
		refresh_interval: 10s
		filters:
		- name: instance-state-name
			values:
			- running
		- name: tag:Name
			values:
			- Compute
		- name: instance-type
			values:
			- p2.xlarge
			- p2.8xlarge
			- p2.16xlarge
			- p3.2xlarge
			- p3.8xlarge
			- p3.16xlarge
			- p3dn.24xlarge
			- p4d.24xlarge
			- g3s.xlarge
			- g3.4xlarge
			- g3.8xlarge
			- g3.16xlarge
			- g4dn.xlarge
			- g4dn.2xlarge
			- g4dn.4xlarge
			- g4dn.8xlarge
			- g4dn.16xlarge
			- g4dn.12xlarge
			- g4dn.metal
	relabel_configs:
	- source_labels: [__meta_ec2_tag_Name]
		target_label: instance_name
	- source_labels: [__meta_ec2_tag_Application]
		target_label: instance_grafana
	- source_labels: [__meta_ec2_instance_id]
		target_label: instance_id
	- source_labels: [__meta_ec2_availability_zone]
		target_label: instance_az
	- source_labels: [__meta_ec2_instance_state]
		target_label: instance_state
	- source_labels: [__meta_ec2_instance_type]
		target_label: instance_type
	- source_labels: [__meta_ec2_vpc_id]
		target_label: instance_vpc

remote_write:
- url: https://aps-workspaces.${AWS_DEFAULT_REGION}.amazonaws.com/workspaces/${WORKSPACE_ID}/api/v1/remote_write
	queue_config:
		max_samples_per_send: 1000
		max_shards: 200
		capacity: 2500
	sigv4:
		region: ${AWS_DEFAULT_REGION}
EOF
sudo mkdir -p /etc/prometheus
sudo mv prometheus.yml /etc/prometheus/prometheus.yml
-
You should now be able to test the prometheus install by running:
prometheus --config.file /etc/prometheus/prometheus.yml``
If this works, it’ll start a process listening on http://localhost:9090, you can go ahead and Ctrl-C out of it. Next we’ll setup a systemctl service to run this process automatically in the background.
-
Create a systemctl service file like so:
sudo su
cat > /etc/systemd/system/prometheus.service << EOF
[Unit]
Description=Prometheus Exporter

[Service]
Environment=PATH=/opt/slurm/bin:\$PATH
ExecStart=/usr/bin/prometheus --config.file=/etc/prometheus/prometheus.yml
Restart=on-failure
RestartSec=15
Type=simple

[Install]
WantedBy=multi-user.target
EOF
``
-
Enable the prometheus service, you should see status Running.
sudo systemctl daemon-reload
sudo systemctl enable --now prometheus
sudo systemctl status prometheus
``
-
Test by querying for current metrics:
curl http://localhost:9090/metrics``
Congrats! We just setup a managed Prometheus server. In the next section we’ll add useful data to prometheus, starting with Slurm exporters.
Setup Exporters
Now that we have the base infrastructure in place we can start setting up exporters, these serve to collect information and send it to Prometheus. We’ll start with the Slurm exporter.
Setup Slurm Prometheus Exporter
-
Install and Compile Slurm exporter on HeadNode:
sudo yum install -y golang
git clone -b 0.20 https://github.com/vpenso/prometheus-slurm-exporter.git
cd prometheus-slurm-exporter
make && sudo cp bin/prometheus-slurm-exporter /usr/bin/
``
-
Start the systemctl service on the HeadNode:
sudo su
cat > /etc/systemd/system/prometheus-slurm-exporter.service << EOF
[Unit]
Description=Prometheus SLURM Exporter

[Service]
Environment=PATH=/opt/slurm/bin:\$PATH
ExecStart=/usr/bin/prometheus-slurm-exporter
Restart=on-failure
RestartSec=15
Type=simple

[Install]
WantedBy=multi-user.target
EOF

sudo systemctl daemon-reload
sudo systemctl enable --now prometheus-slurm-exporter
sudo systemctl status prometheus-slurm-exporter
``
-
Test by querying for current metrics:
curl http://localhost:8080/metrics``
Setup Node Exporter
-
Similar to the Slurm exporter, we’ll also setup Node exporter a tool that publishes stats about each instance. To get started we’ll download and run it:
wget https://github.com/prometheus/node_exporter/releases/download/v1.6.1/node_exporter-1.6.1.linux-amd64.tar.gz
tar xvfz node_exporter-*.*-amd64.tar.gz
cd node_exporter-*.*-amd64
sudo mv node_exporter /usr/bin
``
-
Next setup a systemctl service to automatically run the service. Make sure the status says Running.
sudo su
cat > /etc/systemd/system/node-exporter.service << EOF
[Unit]
Description=Prometheus Node Exporter

[Service]
ExecStart=/usr/bin/node_exporter
Restart=on-failure
RestartSec=15
Type=simple

[Install]
WantedBy=multi-user.target
EOF

sudo systemctl daemon-reload
sudo systemctl enable --now node-exporter
sudo systemctl status node-exporter
``
-
Test by querying for current metrics:
curl http://localhost:9100/metrics``
Setup DCGM Exporter
DCGM Exporter is a tool for exporting GPU Metrics from Nvidia GPU’s. Here’s an example of the stats you can monitor:
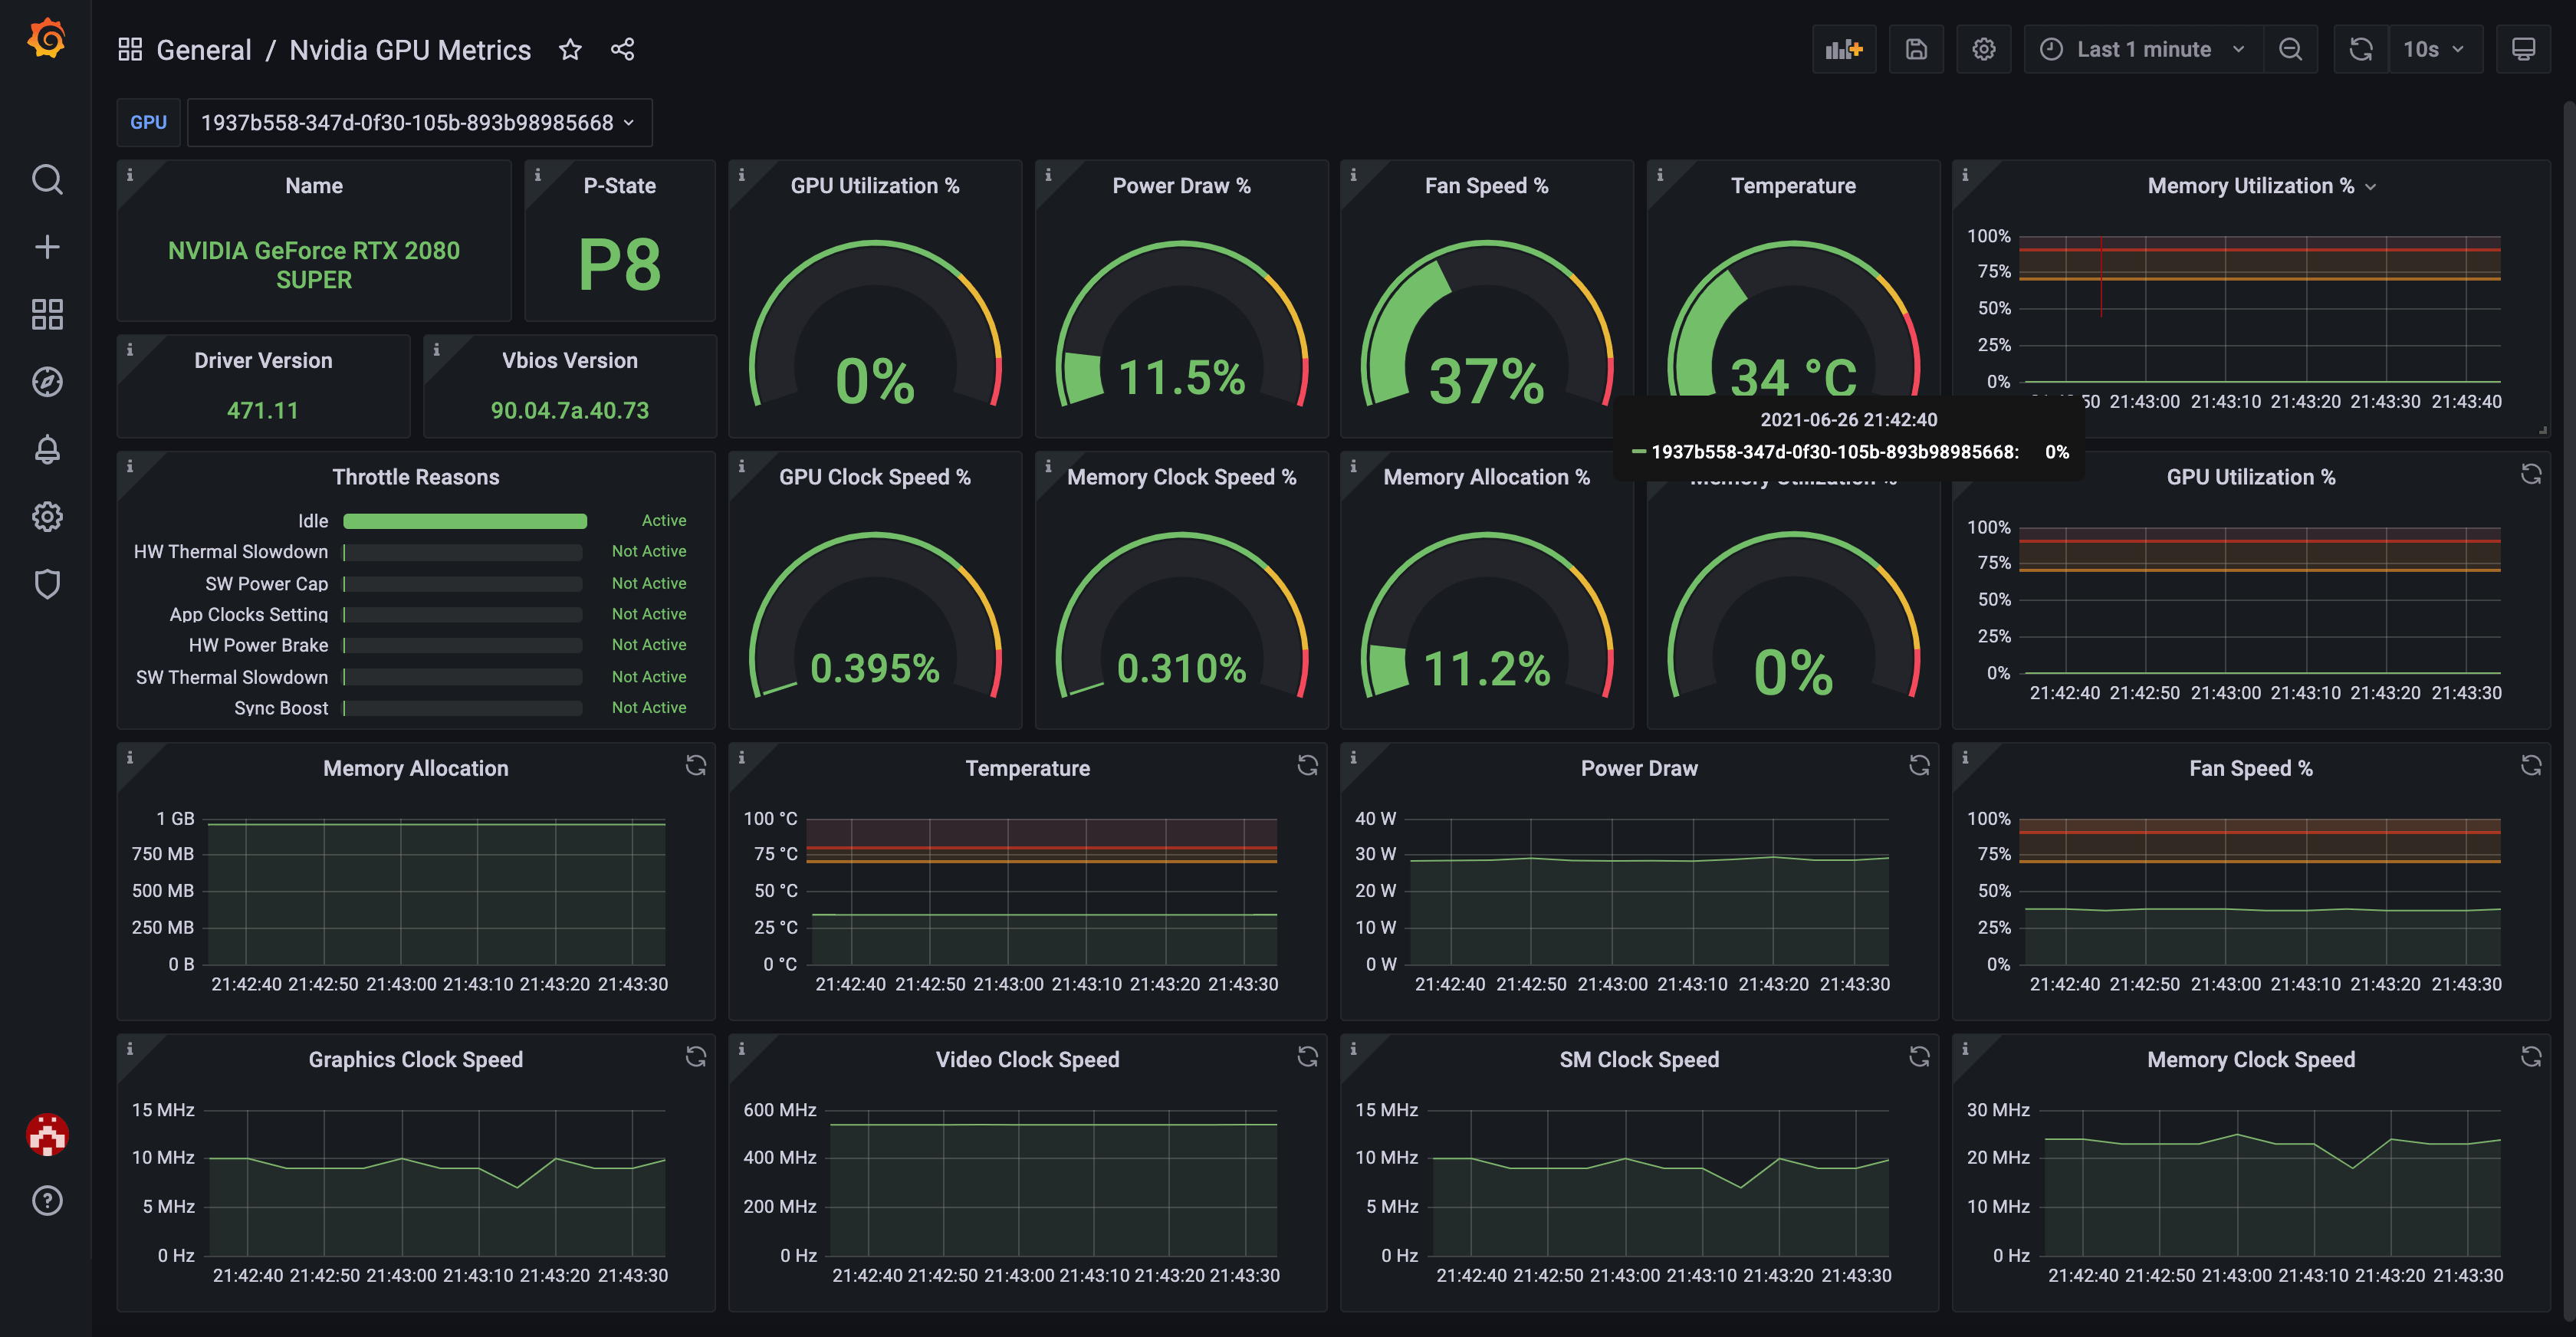
You’ll need to have DCGM installed on the AMI - it’s pre-installed on the Deep Learning AMI so I’ll assume you already have it. To check for it run:
systemctl status nvidia-dcgm
-
Now we can install & build dcgm-exporter:
git clone https://github.com/NVIDIA/dcgm-exporter.git
cd dcgm-exporter/
make binary
sudo make install
``
-
Enable it:
sudo su
cat > /etc/systemd/system/dcgm-exporter.service << EOF
[Unit]
Description=dcgm Exporter

[Service]
ExecStart=/usr/bin/dcgm-exporter
Restart=on-failure
RestartSec=15
Type=simple

[Install]
WantedBy=multi-user.target
EOF
``
Import Dashboards
Next we can add dashboards to Grafana to display all this information!